
Fake data is usually boring if you analyze it. It’s usually uniform, with no outliers or interesting patterns.
If I ask ChatGPT:
Generate realistic fake tourism data using these columns:
- Age
- Nationality
- Gender
- Income
- Booking_Channel
- Month
- Occupancy_Rate
- Travel_Frequency
- Spending
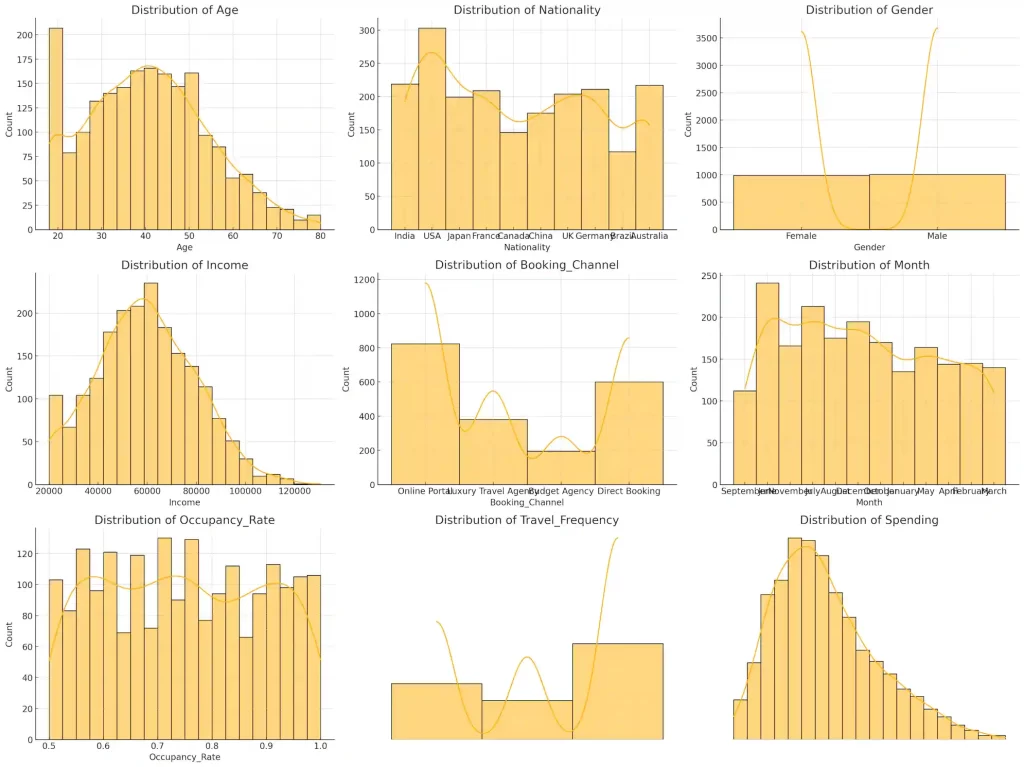
Run the code and let me download the output as a CSV file.… the output is remarkably boring.
- Men & women from all countries and ages in every month visit equally.
- Income and spending are uniformly distributed – and the same pattern holds for all countries and ages.
Often, I need to generate fake data that is interesting. Specifically, I need data that can be used to illustrate a point or show a pattern.
Instead, we could ask for something different. ChatGPT
I want to generate realistic fake tourism data using these columns:
- Age
- Nationality
- Gender
- Income
- Booking_Channel
- Month
- Occupancy_Rate
- Travel_Frequency
- Spending
Do it as follows:
STEP 1. Given such data, generate 5 hypotheses on that a tourism department might test to increase tourist spend.
STEP 2. Write a Python program that generates 2,000 rows of realistic fake data where these hypotheses are true in a statistically significant way.
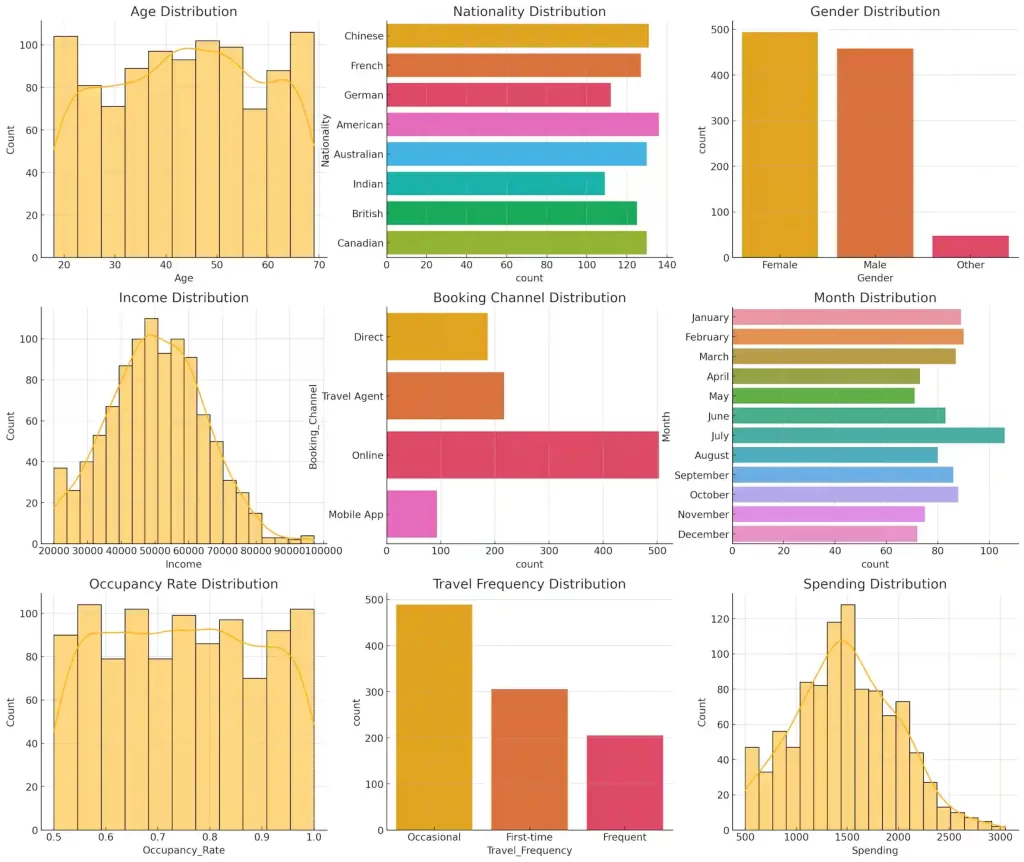
STEP 3. Run the code and let me download the output as a CSV file.This works like a charm. The data generated exhibits these patterns:
- Luxury travel agency customers spend much more.
- Peak-month travelers (June, July, December) spend more.
- Frequent travelers spend less.
- Older tourists (50+) spend more.
- Tourists from USA, Germany, and Japan spend more.
The data is more varied: some 20-year-olds spend much less (creating outliers). Many tourists come from the US, and a large share book online.
So, here’s my generic prompt for realistic fake data on ChatGPT:
Generate realistic fake data for ______

STEP 1. List columns that would be present in such data, briefly describing how the data might be distributed.
STEP 2. Given such data, think about an objective and generate 5 hypotheses that an organization might want to test on how to achieve this objective.
STEP 3. Write and run a Python program that generates 2,000 rows of realistic fake data where these hypotheses are true in a statistically significant way. Let me download the output as a CSV file.
STEP 4. Test each hypothesis and show the results.