Jolie No. 1
There are more Bollywood actors in Hollywood. Some are even turning down Hollywood roles.
So we wondered: How easily can a Bollywood actor connect to a Hollywood actor?
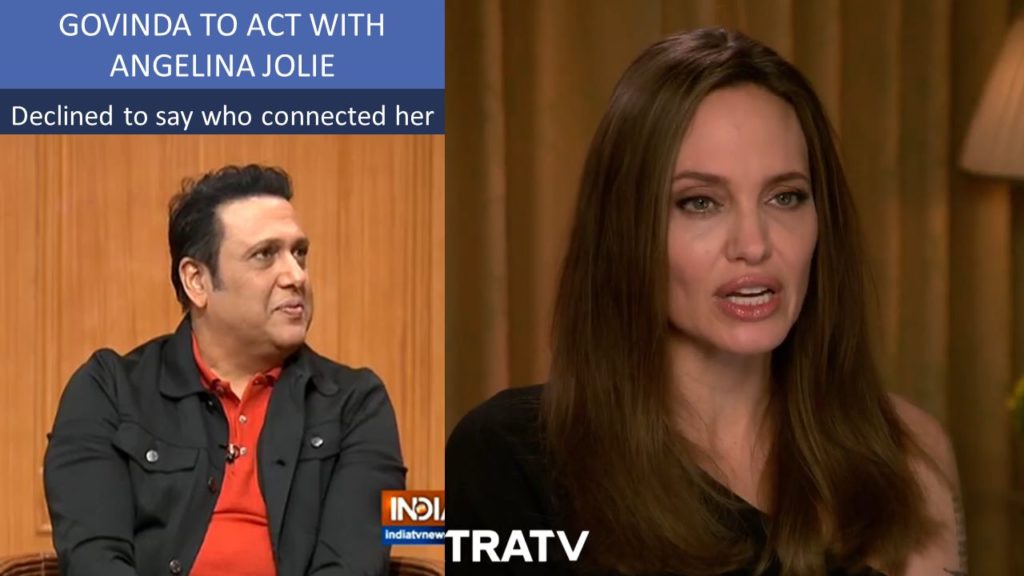
As part of the Oct 2019 Gramener data story hackathon, Anand, Kishore, and Niyas created a Jolie No 1 — a data video where Govinda announces (in our imagination) that he will act with Angelina Jolie in Jolie No 1, but declines to comment on who introduced them.
We picked a theme first
The hackathon theme was “movies”. We explored 5 themes:
- Who acts most in cameo roles, and what’s the impact on revenue? (Based on The Numbers)
- Which actors acted often together? (Based on IMDb data)
- Which movies become hits on TV? (Based on BARC TV data)
- What is the social network of actors in individual movies (https://www.xkcd.com/657/)
- Correlation of TV series actors and their revenues
We explored insights next
We picked the first two themes because we liked them.
1. Cameo appearances
Some observations were:
- Stan Lee starred in 45 cameo roles. No one even comes close. Some roles are:
- A school bus driver in Avengers: Infinity War (2018)
- A strip club DJ in Deadpool (2016)
- A hot-dog vendor in X-Men (1995)
- Jay Leno (25) and Larry King (21) follow, mostly starring as themselves
- Alfred Hitchcock (16) has famous cameo appearances in most of his films, such as:
- Man mailing letter in Suspicion (1941)
- Man winding the clock in Rear Window (1954)
- Man walking the docs in The Birds (1963)
We didn’t have inflation-adjusted box-office revenues, so we couldn’t compare the revenues.
2. Which actors acted often together
Some observations were:
- Top hero-heroine combo:
- Overall: Prem Nazir & Jayabharati
- Hollywood: Billy Dee & Mike Horner (pornstars)
- Tollywood: Krishna Ghattamaneni & Jaya Prada
- Bollywood: Jeetendra & Rekha
- Top male combo: Sivaji Ganesan & Nagesh (more recently, Senthil & Goundamani)
- Top female combination: Lalitha & Padmini
- Top pair of:
- Shah Rukh Khan: Rani Mukherji
- Amitabh Bachchan: Hema Malini
- Kamal Haasan: Sridevi
- Rajinikanth: Sridevi
- Sridevi: Krishna Ghattamaneni
- Chiranjeevi: Vijayshanti
- Dev Anand: Madhubala
The observations focus on Bollywood and Hollywood (because of our familiarity) — but there are number of insights on Japanese and French films too.
We decided to go with this theme because it offered multiple storylines:
- Some actors pair up with each other, e.g. Gemini – Savithri
- Some actors have a big “following” e.g. Rajinikanth, Kamal Hassan, Jitendra have acted most with Sridevi
- Some actors form cliques — working only with each other
- Often, comedians are the bridge between cliques
- It’s interesting to see how actors from one clique can connect to another
Creating the storyline
When exploring of actors’ connections, we found a clearly delineated network structure.
The group of densely clustered actors is the Bollywood-Tollywood-Mollywood-Kollywood nexus. It appears disconnected from the Hollywood cluster. (We excluded anyone who hadn’t acted together in at least 4 films.)
The data was created using this Jupyter notebook.
We realized that it’s tough for someone in Bollywood to connect to Hollywood. Maybe that could be the plot? For example, what if Amitabh Bachchan wants to act with Metryl Streep?
But this isn’t an interesting story. So we asked:
- Who is the most desirable heroine in Hollywood? Our guess was Angelina Jolie
- Who would make funny co-actor? We toggled between Rajanikanth, Brahmanandam, and finally picked Govinda.
The plot summary was: Govinda wants to act with Angelina Jolie. Who can connect them?
The analysis is in this Jupyter notebook.
Write the screenplay
The morning of the hackathon was spent finalizing the screenplay and dialogues, written on Dropbox Paper.
CUT TO:
    - Video of Govinda "declining James Cameron's Avatar" on Aap Ki Adalat
    - Niyas: On July 29, 2019, Govinda announces he declined a role in Avatar.
    - Video: https://youtu.be/NyFF18a7e-Y
    - Picture: https://twitter.com/mohan_rajkeshav/status/1156148768049262592

CUT TO:
    - Visual: Show an interview video of Govinda and of Angelina
    - Niyas: Today, he announced his next film with Angelina Jolie.
             A “close friend” connected them, but didn't say who.
    - Kishore: Who is this close friend? Why is he not naming them?
    - Video: https://youtu.be/NyFF18a7e-Y (Govinda)
    - Video: https://youtu.be/JNrH1W7aKc8 (Angelina)

CUT TO:
    - Visual: Show the top 8 heroines Govinda has acted with.
              Visualize this data with animation.
              One option is to have Govinda’s pic in the center,
              and have each of these 9 heroine’s images appear around him
              as a circle, with the number of pictures in a link.
              Or as the inverse link distance (e.g. 11 is closest)

    11 Neelam Kothari
    10 Kimi Katkar
    10 Karisma Kapoor
     9 Raveena Tandon
     9 Farha Naaz
     8 Juhi Chawla
     6 Anita Raj
     6 Mandakini
     5 Shilpa Shetty Kundra

    - Niyas: Maybe it’s because it’s one of his heroines?
             He’s mostly acted with Neelam, Kimi and Karishma.
             But none of them has acted with any Hollywood actor.

MORPH TO:
    - Visual: Add these actors with pics to the same visual,
              but clearly differentiated by gender. Also add their names.

    22 Shakti Kapoor
    18 Kader Khan
    13 Gulshan Grover
     9 Anupam Kher
     8 Dharmendra
     7 Johnny Lever
     6 Sadashiv Amrapurkar
     6 Vikas Anand
     6 Sanjay Dutt
     6 Prem Chopra
     6 Asrani

    - Kishore: So maybe this “close friend” is a male actor?
    - Niyas: He’s acted with Gulshan Grover, Kader Khan and Shakti Kapoor a lot.
    - Kishore: Shakti Kapoor is practically his boyfriend!

MORPH TO:
    - Visual: Zoom into Gulshan Grover and Anupam Kher.
              Build a network of film posters around them
              with their Hollywood films (max 2-4)
        - Anupam Kher
            - Bend It Like Beckham
            - Lust & Caution
            - Silver Linings Playbook
            - A Family Man
        - Gulshan Grover
            - Prisoners of the Sun
            - The Second Jungle Book
            - Marigold
            - Monsoon
    - Niyas: Gulshan Grover and Anupam Kher have acted in a number of Hollywood films
    - Kishore: But have they acted with Angelina Jolie?
    - Niyas: No, never with Angelina Jolie.
    - Kishore: But what if any of them connected him to someone who connected him to Angelina?

CUT TO:
    - Visual: Show Angelina Jolie with ~100 actors around her. Highlight the following:
        - Jack Black, 3
        - Dustin Hoffman, 3
        - Giovanni Ribisi, 2
        - Robert De Niro, 2
        - Brad Pitt, 2
        - Elle Fanning, 2
        - Bryan Cranston, 2
        - 92 other actors with only 1 film each
        - Highlight Irrfan Khan — A Mighty Heart
    - Niyas: Angelina Jolie has acted with less than 100 actors.
             Dustin Hoffman and Jack Black, mostly.
             Only one of them is an Indian actor: Irrfan Khan

MORPH TO:
    - Visual: Expand the connection between Angelina and Irrfan
    - Kishore: So, Govinda needs to connect to Irrfan Khan somehow.

MORPH TO:
    - Visual: Connect Govinda to Irrfan Khan via
        - Gulshan Grover via Knock Out
        - Sanjay Dutt via Knock Out
        - Tabu via Saajan Chale Sasural, Dil Ne Phir Yaad Kiya (and 2 others)
    - Niyas: That should be easy.
             Gulshan Grover and Irrfan Khan have acted together in Knock Out.
             So has Sanjay Dutt.
             But Tabu will be a better option. Govinda and Irrfan Khan have acted with her in 4 movies each.

MORPH TO:
    - Visual: Show path from Govinda to Tabu to Irrfan to Angelina.
    - Kishore: Then, Govinda must have connected to Tabu
               who introduced him to Irrfan Khan,
               who in turn connected him with Angelina Jolie.
Create the video
Anand and Niyas created the visuals on PowerPoint, collaborating on Dropbox.
This is the first version of the presentation. It uses morph transitions extensively.
Niyas and Kishore recorded the audio in two parts on their phone, shared it with Anand via WhatsApp.
We integrated these using the Windows 10 video editor. It’s simple, but now powerful. For our use, simplicity was more important.
The process took 6 hours (from 8 am to 2 pm).
- Writing the screenplay and dialogues: 1.5 hours
- Creating the presentation: 2 hours
- Recording the audio: 1 hour
- Integrating into the video: 1.5 hours
At the last minute, we picked the title “Jolie No. 1” as a parody of Govinda’s No. 1 film series).
We published this on Google Drive, and then on YouTube.

