Calvin, speechless


Calvin, speechless Read More »
Recently, I have ended up giving bits of advice to people recruiting at start-ups, and a few patterns have emerged that are worth sharing.
Before I go ahead, I should warn you that I have no qualifications whatsoever. (All consulting advice should come with this caveat, perhaps!) You might be better off reading Joel Spolsky’s Smart and Get Things Done (read). I haven’t read it myself, but from what little I see of it, the thoughts seem similar.
The key is to realise that smart people are probably 10 times as productive. OK, that may be wrong. It probably originated with Fred Brooks, and has been debated to death. But it seems fairly well accepted that the best people contribute more than they are better paid. (The best guy is probably paid twice the average, but is worth more than twice the average guy.)
This isn’t because they do more work. It’s because they solve harder problems. You can get two people to do two people’s work. You can’t solve a problem twice as hard even with twenty people.
For a startup, the problem is acute. You don’t have the luxury of being able to manage a large number of people.
Since smart people typically work for a lot less than they’re probably worth, it’s a bargain to hire smart people. You pay them twice as much, and they’ll solve problems twenty others couldn’t solve.
The problem boils down to finding smart people and getting them on board.
Finding smart people
You need to go after the smart people. They won’t come to you. Many reasons. You’re not big enough. There aren’t that many of them. They’re not in the market that much (no one lets go of them anyway).
So that just demolishes the traditional recruitment model straight away. You don’t advertise for people and filter their resumes. You find the people you want and go after them.
The good thing is, smart people cluster. They tend to know other smart people, meet up with other smart people, read the same things as other smart people, etc. That gives some useful starting points.
Matt Biddulph talks about Algorithmic recruitment with Github. The premise is that smart programmers are at the centre of the social networks in their respective areas. Just go after them. I advised a friend similarly: to look for the network (or at least the smart people) that hang out on Stack Overflow for a given topic. Last year, when I was looking for a Django developer, I scoured the Infosys internal blogs for similar networks. (Found only a few, but it sure introduced me to a lot of really smart people that I didn’t know existed!)
Conferences are another place to look for them. I tend to periodically check out Upcoming and Meetup to see who’s taking part in what, go over, meet them, and see what they do. I find it a great way of figuring out who’re the experts in a field. (I once met one of the guys who wrote TiddlyWiki, and it was immediately obvious that he was in a different league from the others that day at the Javascript Meetup.)
You can go a step further. Since smart people cluster, they form networks, and control of that network is power. So why not organise those conferences? A lot of these smart people just need a place to hang out and learn from each other. I know the Javascript Meetup was struggling to find a place to meet. Pubs don’t give you the quiet atmosphere needed to learn from each other, and it’s certainly impossible to have a talk there. The folks at Hackspace have done this really well, renting a place and equipment for people to tinker with electronics.
That’s what smart people want, mostly: a nice quiet place, good company, and perhaps pizza. Skills Matter does this beautifully. They organise free workshops every now and then. The list of people that attend these is invaluable.
Getting them on board
Once you’ve spotted a smart person, what do you offer them?
Remember – they’re probably 10 times as productive. Money is quite likely to be worth offering. If that works, great. But if you’re a startup, you probably don’t have the money. You probably could offer a stake in the firm. That might work too.
But, to quote Dan Pink: “One of the most robust findings of social science is that incentives dull the mind and hamper creativity. Yet, businesses ignore it.” Some people aren’t motivated by money. You might get better results if you didn’t pay money than if you did. (Read this story on motivation by Peter Bregman.)
Suppose you said, “I have this problem… I’ve no idea how to solve it. Would you be able to help me?” Most smart people would probably help you. For free. The feel good feeling is worth more than the transaction cost of extracting payment from you.
Or you might be championing a worthy cause – anywhere from world hunger, rural poverty or cure for cancer down to organising a scout camp. The thing about this is they are intrinsically attractive. You probably just need to open up and say “This is what I’m doing, can you help?”
The flip side of it is loss of control. Jonty told me about how Hackspace London was run: “it’s as loosely organised as possible without falling apart”. You don’t manage these people like traditional organisations. You manage them like a community of volunteers. Like parents at a school day function. Like family at a wedding. You don’t pay them. You don’t order them around either.
Part of that is the flexibility of being a startup. You can afford that loss of control. Yes, you don’t have the money. No, not everyone’s working for money. (The planet as a whole is fairly well off. Smart people particularly so.) But you might offer something interesting. Just as long as you’re willing to let go of some control in your mind…
Recruiting smart people Read More »
I wrote about SSH Tunneling through web filters using Amazon’s EC2 at 8 cents/hr. With Rackspacecloud, you can get that down to 1.5 cents/hr. This turns out to be a lot simpler than EC2 as well!
Ingredients
Directions


sed –i "s/^Port 22/Port 443/" /etc/ssh/sshd_config
/etc/init.d/ssh restart


SSH Tunneling via Rackspacecloud Read More »

That dip there in response time is thanks to WP-SuperCache. My average page load time has dropped from 1 second to 0.25 seconds.
I just got a digital wattmeter. Had no idea about these until Google PowerMeter, but now, they’re all the rage. Mine’s a pretty simple model and all I plan to do with it is play around with a few household gadgets.

My first target, obviously, was my Dell Latitude E5400. The statistics are interesting:
| Power | … when… |
|---|---|
| 0.3W | Laptop is switched off. The adapter must be consuming the power |
| 1.3W | Laptop is on standby. |
| 12W | The lid is closed, and no applications are running. |
| 18.5W | The laptop is on, the lid is open, and no applications are running |
| 25W | The laptop is writing to the hard disk |
| 34W | One CPU is fully utilised |
| 41W | Both CPUs are fully utilised |
Looks like the display and hard disk each consume about 6.5 watts each, while the CPU consumes a whopping 15 + 7 = 22 watts.
One interesting observation is that the colour of the display doesn’t make much of a difference. From my CRT monitor days, I’d remembered that a black screen consumes less power, and is less likely to wear the screen off. So my desktop background has always been black, and most of my applications use a black theme. But it turns out that on LCDs, it makes absolutely no difference. A full white screen uses the same power as a full black screen. So I’ve really been wasting my time the last 9 years. (There is a good reason to have a black screen, sometimes – it’s much easier on the eyes when reading without lights.)
Another lesson was that turning off the wireless had no effect whatsoever. (It worked quite well for my Blackberry, though. Increased the battery life quite a bit. I thought the same might apply for laptops, but looks like it doesn’t.)
I’ll do an audit of some of my home appliances and post it out here. Wonder if there’s a repository of power usage for appliances…
Laptop power usage Read More »
When I’m in front of my laptop, I usually forget the world around. Sadly, the world around has important things that need to get done on time. Like eating medicines, turning off the washing machine or the hob, etc.
The one thing I’ve been lacking on my machine was a simple alarm system. I’d like to set an alarm to remind me to do something in 5 minutes, for example. And it should be dead simple to set up.
After hunting around a fair for freeware to do this, I’ve finally settled on writing this tiny piece of Visual Basic code.
Set WshShell = CreateObject("WScript.Shell") If WScript.Arguments.length < 2 Then WScript.Echo "Usage: alarm <time-in-minutes> <message>" Else WScript.Sleep WScript.Arguments.Item(0) * 60 * 1000 msg = "" For i = 1 to WScript.Arguments.Count - 1 msg = msg + WScript.Arguments.Item(i) + " " Next WshShell.Popup msg, -1, "Alarm", 64 End If |
I’ve saved this as “alarm.vbs” somewhere in my path. When I need to set an alarm, I just type
alarm 5 Turn off the hob
This pops up a window in 5 minutes with the alarm:

This turned out to be a life-saver yesterday. I had to catch a flight at the Bangalore airport, and traffic is notoriously bad. To be on the safe side, I set up the following:
alarm 25 Catch the flight
alarm 30 You really need to go now
alarm 35 You've missed the flight
Turned out to be a wise thing. I ignored the first alarm. On the second, I said “OK, OK, just 1 minute…” and it really took the third alarm to get me going. Just barely made it to the flight.
Command line alarm Read More »
I’m totally hooked to portable apps now. You don’t need admin rights to install them. You can run them off a USB stick. They won’t make your machine slower. All the reasons not to install an application vanish.
PortableApps.com is a good starting point. For what it’s worth, here are my portable apps by category (most used on top).
Platforms
Tiny utilities
Media
Servers
Development tools
Let me repeat:
There’s really no reason whatsoever not to have them on a USB stick at least. They’re cheap.
You can defeat most web filters by spending around 8 cents/hr 0 cents/hr on Amazon EC2. (It’s usually worth the money. It’s a fraction of the cost a phone call or a sandwich. And I usually end up wasting that money anyway on calling someone or eating my way out of the misery of corporate proxies.)
Most web filters and proxies block all ports except the HTTP port (80) and the HTTPS port (443). But it’s used to carry encrypted traffic, and, as Mark explains:
since all the traffic that passed through the tunnel is supposed to be SSL encrypted (so as to form an unhindered SSL session between the browser and the HTTPS server), there are little or no access controls possible on such a tunnel
That means web filters can’t really block HTTPS traffic. So we can redirect web traffic to a local HTTPS server, and set up a server outside the firewall that redirects them back to the regular servers.
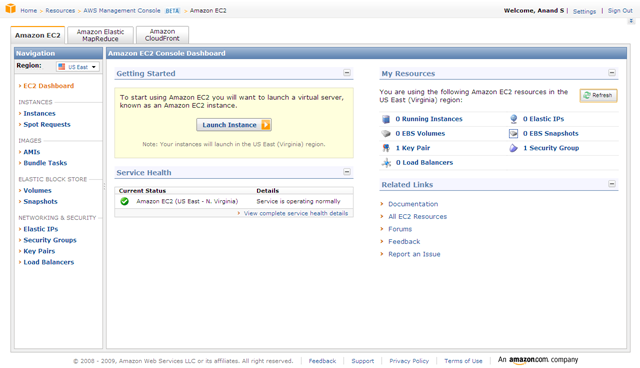
Putty will be our local HTTPS server. Amazon EC2 gives us a server outside the firewall.
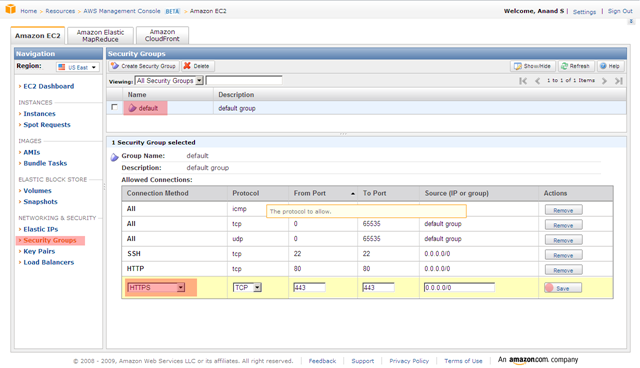
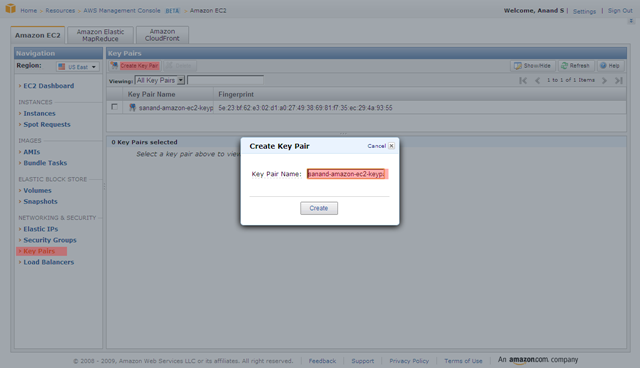
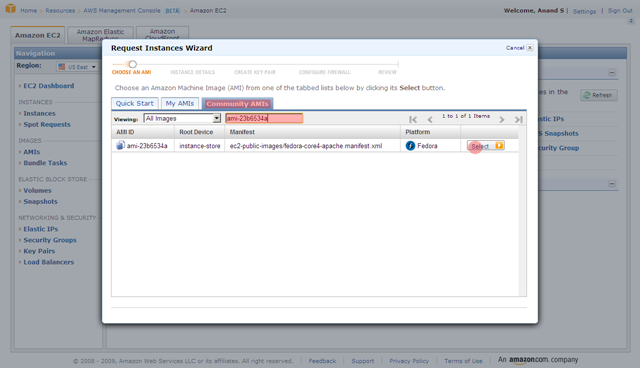
So here’s a 16-step recipe to bypass your web filter. (This is the simplest I could make it.)
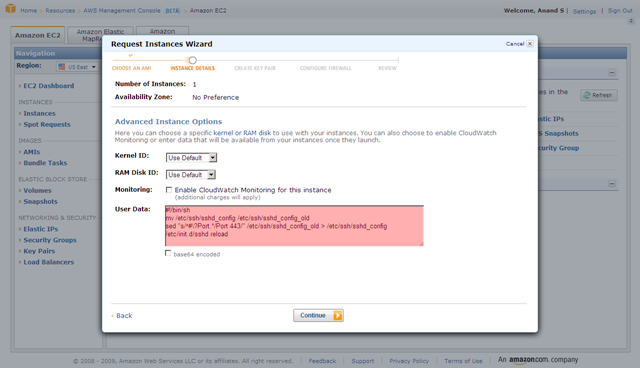
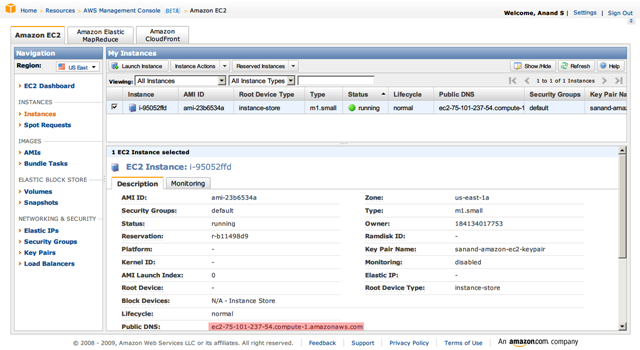
In Steps 1-7, we’ll launch a server on Amazon EC2 with 2 tweaks. Step 1 enables Port 443, and step 6 re-configures SSH to run on Port 443 instead of on Port 22. (Remember: most proxies block all ports other than 80 and 443). Alestic’s article on how to Automate EC2 Instance Setup with user-data Scripts and this thread on running SSH on port 443 are invaluable.
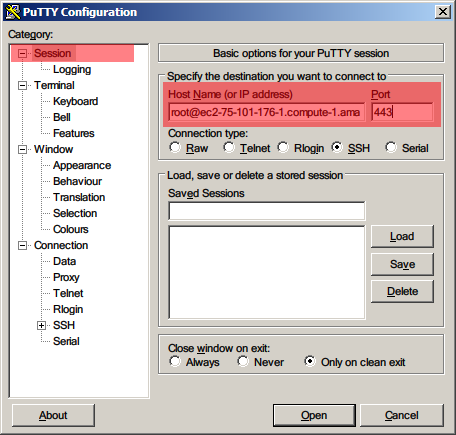
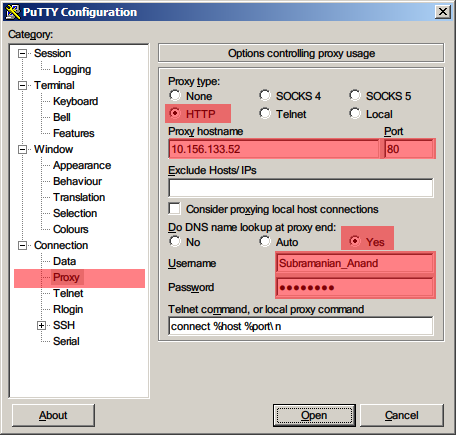
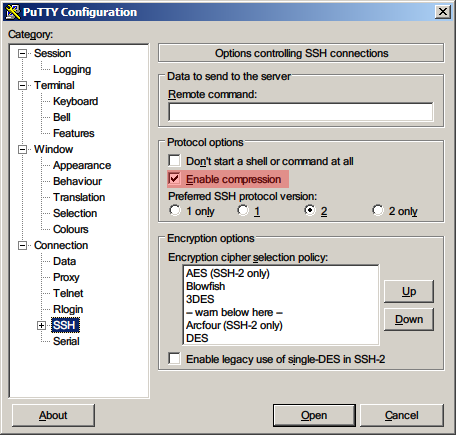
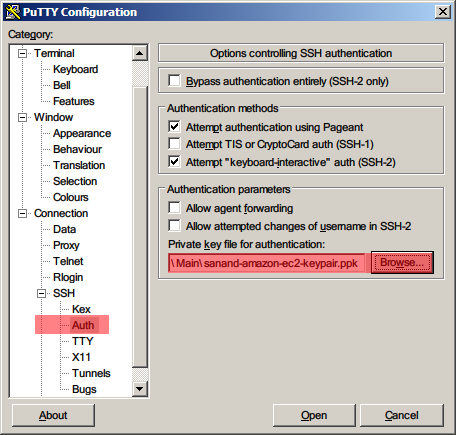
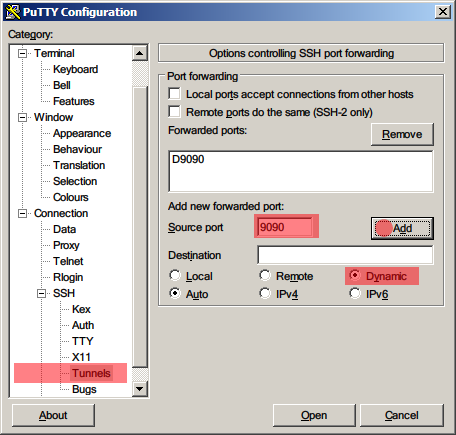
In Steps 8-13, we’ll set up Putty as our local HTTPS server. Read how to set up Putty as a SOCKS server and how to use Putty with a HTTP proxy. All I did was to combine the two.
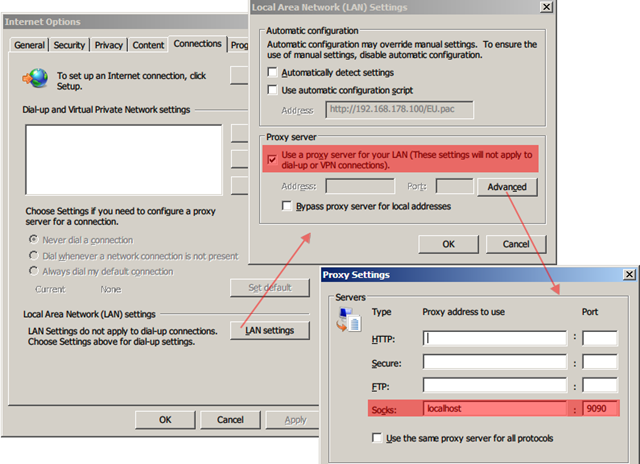
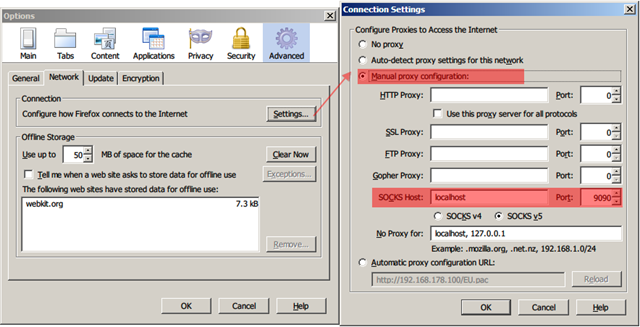
In steps 14-16, we’ll configure the browser to use the Putty as the SOCKS server.
Ingredients
Directions
#!/bin/bash
mv /etc/ssh/sshd_config /etc/ssh/x
sed "s/^#\?Port.*/Port 443/" /etc/ssh/x > /etc/ssh/sshd_config
/etc/init.d/ssh restart
That’s it. You should now be able to check most blocked sites like Facebook and YouTube.
Those who favour the command line may want to automate Steps 1-7 by downloading Amazon’s EC2 API tools. EC2 API tools work from behind a proxy too. The commands you’ll need to use to setup are:
set EC2_HOME=your-ec2-home-directory

set EC2_CERT=your-ec2-certificate

set EC2_PRIVATE_KEY=your-ec2-private-key

ec2-add-keypair mykeypair

ec2-authorize default -p 443

set EC2_JVM_ARGS=-DproxySet=true -DproxyHost=yourproxy \

-DproxyPort=yourport -Dhttps.proxySet=true \

-Dhttps.proxyHost=yourproxy -Dhttps.proxyPort=yourport \

-Dhttp.proxyUser=yourusername -Dhttps.proxyUser=yourusername \

-Dhttp.proxyPass=yourpassword -Dhttps.proxyPass=yourpassword

ec2-run-instances ami-ccf615a5 --key mykeypair --user-data-file your-startup-file-containing-lines-in-step-6
You can go further and use any software (such as Skype) if you install FreeCap. More details are in this article on Secure Firefox and IM with Putty.
Linux users may want to check out ProxyTunnel and this article on Tunneling SSH over HTTP(S).
Update: Follow-ups on hacker news comments, twitter, delicious and digg.
SSH Tunneling through web filters Read More »