Year: 2012

Github page-only repository

Github offers Github Pages that let you host web pages on Github.

You create these by adding a branch to git called gh-pages, and this is often in addition to the default branch master.

I just needed the gh-pages branch. So thanks to YJL, here’s the simplest way to do it.

  1. Create the repositoryon github.
  2. Create your local repository and git commitinto it.
  3. Type git push -u origin master:gh-pages
  4. In .git/config, under the [remote "origin"] section, add push = +refs/heads/master:refs/heads/gh-pages

The magic is the last :gh-pages.

The most popular scientific Python modules

I just scraped the scientific packages on pypi. Here are the top 50 by downloads.

Name Description Size Downloads
numpy NumPy: array processing for numbers, strings, records, and objects. 2000000 133076
scipy SciPy: Scientific Library for Python 7000000 33990
pygraphviz Python interface to Graphviz 99000 22828
geopy Python Geocoding Toolbox 32000 18617
googlemaps Easy geocoding, reverse geocoding, driving directions, and local search in Python via Google. 69000 15135
Rtree R-Tree spatial index for Python GIS 495000 14370
nltk Natural Language Toolkit 1000000 12844
Shapely Geometric objects, predicates, and operations 93000 12635
pyutilib.component.doc Documentation for the PyUtilib Component Architecture. 372000 10181
geojson Encoder/decoder for simple GIS features 12000 9407
GDAL GDAL: Geospatial Data Abstraction Library 410000 8957
scikits.audiolab A python module to make noise from numpy arrays 1000000 8856
pupynere NetCDF file reader and writer. 16000 8809
scikits.statsmodels Statistical computations and models for use with SciPy 3000000 8761
munkres munkres algorithm for the Assignment Problem 42000 8409
scikit-learn A set of python modules for machine learning and data mining 2000000 7735
networkx Python package for creating and manipulating graphs and networks 1009000 7652
pyephem Scientific-grade astronomy routines 927000 7644
PyBrain PyBrain is the swiss army knife for neural networking. 255000 7313
scikits.learn A set of python modules for machine learning and data mining 1000000 7088
obspy.seisan SEISAN read support for ObsPy. 3000000 6990
obspy.wav WAV(audio) read and write support for ObsPy. 241000 6985
obspy.seishub SeisHub database client for ObsPy. 237000 6941
obspy.sh Q and ASC (Seismic Handler) read and write support for ObsPy. 285000 6926
crcmod CRC Generator 128000 6714
obspy.fissures DHI/Fissures request client for ObsPy. 1000000 6339
stsci.distutils distutils/packaging-related utilities used by some of STScI’s packages 25000 6215
pyopencl Python wrapper for OpenCL 1000000 6124
Kivy A software library for rapid development of hardware-accelerated multitouch applications. 11000000 5879
speech A clean interface to Windows speech recognition and text-to-speech capabilities. 17000 5809
patsy A Python package for describing statistical models and for building design matrices. 276000 5517
periodictable Extensible periodic table of the elements 775000 5498
pymorphy Morphological analyzer (POS tagger + inflection engine) for Russian and English (+perhaps German) languages. 70000 5174
imposm.parser Fast and easy OpenStreetMap XML/PBF parser. 31000 4940
hcluster A hierarchical clustering package for Scipy. 442000 4761
obspy.core ObsPy – a Python framework for seismological observatories. 487000 4608
Pyevolve A complete python genetic algorithm framework 99000 4509
scikits.ann Approximate Nearest Neighbor library wrapper for Numpy 82000 4368
obspy.imaging Plotting routines for ObsPy. 324000 4356
obspy.xseed Dataless SEED, RESP and XML-SEED read and write support for ObsPy. 2000000 4331
obspy.sac SAC read and write support for ObsPy. 306000 4319
obspy.arclink ArcLink/WebDC client for ObsPy. 247000 4164
obspy.iris IRIS Web service client for ObsPy. 261000 4153
Orange Machine learning and interactive data mining toolbox. 14000000 4099
obspy.neries NERIES Web service client for ObsPy. 239000 4066
pandas Powerful data structures for data analysis, time series,and statistics 2000000 4037
pycuda Python wrapper for Nvidia CUDA 1000000 4030
GeoAlchemy Using SQLAlchemy with Spatial Databases 159000 3881
pyfits Reads FITS images and tables into numpy arrays and manipulates FITS headers 748000 3746
HTSeq A framework to process and analyze data from high-throughput sequencing (HTS) assays 523000 3720
pyopencv PyOpenCV – A Python wrapper for OpenCV 2.x using Boost.Python and NumPy 354000 3660
thredds THREDDS catalog generator. 25000 3622
hachoir-subfile Find subfile in any binary stream 16000 3540
fluid Procedures to study geophysical fluids on Python. 210000 3520
pygeocoder Python interface for Google Geocoding API V3. Can be used to easily geocode, reverse geocode, validate and format addresses. 7000 3514
csc-pysparse A fast sparse matrix library for Python (Commonsense Computing version) 111000 3455
topex A very simple library to interpret and load TOPEX/JASON altimetry data 7000 3378
arrayterator Buffered iterator for big arrays. 7000 3320
python-igraph High performance graph data structures and algorithms 3000000 3260
csvkit A library of utilities for working with CSV, the king of tabular file formats. 29000 3236
PyVISA Python VISA bindings for GPIB, RS232, and USB instruments 237000 3201
Quadtree Quadtree spatial index for Python GIS 40000 3000
ProxyHTTPServer ProxyHTTPServer — from the creator of PyWebRun 3000 2991
mpmath Python library for arbitrary-precision floating-point arithmetic 1000000 2901
bigfloat Arbitrary precision correctly-rounded floating point arithmetic, via MPFR. 126000 2879
SimPy Event discrete, process based simulation for Python. 5000000 2871
Delny Delaunay triangulation 18000 2790
pymc Markov Chain Monte Carlo sampling toolkit. 1000000 2727
PyBUFR Pure Python library to encode and decode BUFR. 10000 2676
collective.geo.bundle Plone Maps (collective.geo) 11000 2676
dap DAP (Data Access Protocol) client and server for Python. 125000 2598
rq RQ is a simple, lightweight, library for creating background jobs, and processing them. 29000 2590
pyinterval Interval arithmetic in Python 397000 2558
StarCluster StarCluster is a utility for creating and managing computing clusters hosted on Amazon’s Elastic Compute Cloud (EC2). 2000000 2521
fisher Fast Fisher’s Exact Test 43000 2503
mathdom MathDOM – Content MathML in Python 169000 2482
img2txt superseded by asciiporn, http://pypi.python.org/pypi/asciiporn 443000 2436
DendroPy A Python library for phylogenetics and phylogenetic computing: reading, writing, simulation, processing and manipulation of phylogenetic trees (phylogenies) and characters. 6000000 2349
geolocator geolocator library: locate places and calculate distances between them 26000 2342
MyProxyClient MyProxy Client 67000 2325
PyUblas Seamless Numpy-UBlas interoperability 51000 2252
oroboros Astrology software 1000000 2228
textmining Python Text Mining Utilities 1000000 2198
scikits.talkbox Talkbox, a set of python modules for speech/signal processing 147000 2188
asciitable Extensible ASCII table reader and writer 312000 2160
scikits.samplerate A python module for high quality audio resampling 368000 2151
tabular Tabular data container and associated convenience routines in Python 52000 2114
pywcs Python wrappers to WCSLIB 2000000 2081
DeliciousAPI Unofficial Python API for retrieving data from Delicious.com 19000 2038
hachoir-regex Manipulation of regular expressions (regex) 31000 2031
Kamaelia Kamaelia – Multimedia & Server Development Kit 2000000 2007
seawater Seawater Libray for Python 2000000 1985
descartes Use geometric objects as matplotlib paths and patches 3000 1983
vectorformats geographic data serialization/deserialization library 10000 1949
PyMT A framework for making accelerated multitouch UI 18000000 1945
times Times is a small, minimalistic, Python library for dealing with time conversions between universal time and arbitrary timezones. 4000 1929
CocoPy Python implementation of the famous CoCo/R LL(k) compiler generator. 302000 1913
django-shapes Upload and export shapefiles using GeoDjango. 9000 1901
sympy Computer algebra system (CAS) in Python 5000000 1842
pyfasta fast, memory-efficient, pythonic (and command-line) access to fasta sequence files 14000 1836

Streaming audio to iOS via VLC

You can play a song on your PC and listen to it on your iPhone / iPad – converting your PC into a radio station. As with most things VLC related, it’s tough to figure out but obvious in retrospect.

The first thing to do is set up the MIME type for the streaming. This is a bug that has been fixed, but might not have made it into your version of VLC.

Go to Tools – Preferences.

vlc-pref-1

Click on “All” to see all the settings.

vlc-pref-2

Under Stream output – Access output – HTTP, set Mime to audio/x-mpeg.

vlc-pref-3

At this point, you should restart VLC.

As I mentioned earlier, you might not need to do this if you have new enough a version of VLC that auto-detects the content’s MIME type.

Re-open VLC, and go to the Media – Stream menu.

vlc-stream-1

Click Add and choose the file you want to stream. Then click on Stream.

vlc-stream-2

Click Next.

vlc-stream-3

Select HTTP and click Add.

vlc-stream-4

Select Audio – MP3 and click on Stream.

vlc-stream-5

At this point, the audio is being streamed at port 8080 of your machine. You can change the port and path in the menu above. (To find your local IP address, open the Command Prompt and type ipconfig.)

Open Safari on your iPhone or iPad, and visit http://your-ip-address:8080/

vlc-ipad-streaming

I haven’t figured out the right codec and MIME type to do this for videos yet, but hopefully will figure it out soon.

Magnetix

I wasn’t entirely sure, but now I’m somewhat convinced: Magnetix magnets can form an infinite chain that won’t break due by its own weight.

photo 1 photo 2

(This is not true, however, if you introduce the steel bearing balls between them. That structure collapses pretty quickly if you pull it up like a chain.)

So, this would be a really nice question for What If, IMHO. What if you made a 1 light-year chain of Magnetix? Well, to begin with, we’d need nearly 40 million trillion pieces. That’d cost at least 10 million trillion dollars based on the current prices at Amazon, and would be about 140,000 times the world’s GDP. I’m sure Randall could take this a lot further.

Auto reloading pages

After watching Bret Victor’s Inventing on Principle, I just had to figure out a way of getting live reloading to work. I know about LiveReload, of course, and everything I’ve heard about it is good. But their Windows version is in alpha, and I’m not about to experiment just yet.

This little script does it for me instead:

(function(interval, location) {
  var lastdate = "";
  function updateIfChanged() {
    var req = new XMLHttpRequest();
    req.open('HEAD', location.href, false);
    req.send(null);
    var date = req.getResponseHeader('Last-Modified');
    if (!lastdate) {
      lastdate = date;
    }
    else if (lastdate != date) {
      location.reload();;
    }
  };
  setInterval(updateIfChanged, interval);
})(300, window.location)


It checks the current page every 300 milliseconds and reloads it if the Last-Modified header is changed. I usually include it as a minified script:

<script>(function(d,c){var b="";setInterval(function(){var a=new
XMLHttpRequest;a.open("HEAD",c.href,false);a.send(null);
a=a.getResponseHeader("Last-Modified");if(b)b!=a&&
c.reload();else b=a},d)})(300,window.location)</script>

There are no dependencies on any library, like jQuery. However, it requires that the file be on a web server. (It’s easy to fix that, but since I always run a local webserver, I’ll let you solve that problem yourself.)

Windows XP virtual machine

Here’s the easiest way to set up a Windows XP virtual machine that I could find.

(This is useful if you want to try out programs without installing it on your main machine; test your code on a new machine; or test your website on IE6 / IE7 / IE8.)

  1. Go to the Virtual PC download site. (I tried VirtualBox and VMWare Player. Virtual PC is better if you’re running Windows on Windows.)
    image
    If you have Windows 7 Starter or Home, select “Don’t need XP Mode and want VPC only? Download Windows Virtual PC without Windows XP Mode.”
    If you have Windows Vista or Windows 7, select “Looking for Virtual PC 2007?”
  2. Download it. (You may have to jump through a few hoops like activation.)
  3. Download Windows XP and run it to extract the files. (It’s a 400MB download.)
  4. Open the “Windows XP.vmc” file – just double-clicking ought to work. At this point, you have a working Windows XP version. (The Administrator password is “Password1”.)
  5. Under Tools – Settings – Networking – Adapter 1, select “Shared Networking (NAT)”
    image

That’s pretty much it. You’ve got a Windows XP machine running inside your other Windows machine.

Update (18 Sep 2012): I noticed something weird. The memory usage of VMWindow and vpc.exe is tiny!

image

Between the two processes, they take up less than 30MB of memory. This is despite the Windows XP Task Manager inside the virtual machine showing me 170MB of usage. I’ve no clue what’s happening, but am beginning to enjoy virtualisation. I’ll start up a few more machines, and perhaps install a database cluster across them.

Inspecting code in Python

Lisp users would laugh, since they have macros, but Python supports some basic code inspection and modification.

Consider the following pieces of code:

margin = lambda v: 1 - v['cost'] / v['sales']

What if you wanted another function that lists all the dictionary indices used in the function? That is, you wanted to extract cost and sales?

This is a real-life problem I encountered this morning. I have 100 functions, each defining a metric. For example,

  1. lambda v: v['X'] + v['Y']
  2. lambda v: v['X'] - v['Z']
  3. lambda v: (v['X'] + v['Y']) / v['Z']

I had to plot the functions, as well as each of the corresponding elements (‘X’, ‘Y’ and ‘Z’) in the formula.

Two options. One: along with each formula, maintain a list of the elements used. Two: figure it out automatically.

Each function has a func_code attribute. So, when you take

margin = lambda v: 1 - v['cost'] / v['sales']

margin.func_code is a “code object”. This has a bunch of interesting attributes, one of which is co_consts

>>> margin.func_code.co_consts
(None, 1, 'cost', 'sales')

There — I just pick the strings out of that list and we’re done (for simple functions at least.)

Check out http://docs.python.org/reference/datamodel.html and search for func_ — you’ll find a number of interesting things you can do with functions, such as

  1. Finding and changing the default parameters
  2. Accessing the global variables of the namespace where the function was defined (!)
  3. Replacing the function code with new code

Also search for co_ — you’ll find some even more interesting things you can do with the code:

  1. Find all local variable names
  2. Find all constants used in the code
  3. Find the filename and line number where the code was compiled from

Python also comes with a disassembly module dis. A look at its source is instructive.

Restartable and Parallel

When processing data at a large scale, there are two characteristics that make a huge difference to my life.

Restartability. When something goes wrong, being able to continue from where it stopped. In my opinion, this is more important than parallelism. There’s nothing as depressing as having to start from scratch every time. Think of it as the ability to save a game as opposed to starting from Level 1 in every life.

Parallelism. Being able to run multiple processes in parallel. Often, this is easy. You don’t need threads. Good old UNIX xargs can do a great job of it. Interestingly, I’ve never used Hadoop for any real-life problem. I’ve gotten by with UNIX commands and smart partitioning.

The “smart partitioning” bit is important. For example, if you’re dealing with telecom data, you’d be calculating most of your metrics (e.g. did the number of calls grow or fall, are there more outgoing or incoming calls, etc.) are calculated on a single mobile number. So if you have multiple data sets, as long as all the data related to one mobile number are on the same system, you’re fine. If you have 100 machines, just split the data based on the last 2 digits of the mobile number. So data about 9012345678 would go to machine 78 (the last two digits). Given a mobile number for any type of data, you’d know exactly which machine would have that data. For all practical purposes, that gives you the basics of a distributed file system.

(I’m not saying you don’t need Hadoop. Just that I haven’t needed it.)

Storytelling: Part 1

In a number of sessions I’ve been to, people ask analysts to make their results more interesting – to tell stories with them. I’m co-teaching a course, part of which involves telling stories with data. So this got me thinking: what is a story? How does one teach storytelling to, let’s say, an alien?

Consider this mini-paper.

ABSTRACT: Meter readings exhibit spikes at slab boundaries. We also
find significant evidence of improbably events at round numbers.

Electricity shortage is a serious problem in most Indian states. Part
of this problem is due to the inaccuracy of reporting procedures used
in monitoring meter readings. Our focus here is not to document or
experimentally determine the degree of inaccuracy. We have adopted a
data driven approach to this problem and attempt to model the extent
of inaccuracy using basic statistical analysis techniques such as
histograms and the comparison of means.

Our dataset comprises of the frequency analysis 12-month dataset
containing monthly meter readings of 1.8 million customers in the
State of Andhra Pradesh.

We find that a histogram of these readings shows unexpectedly high
values at the slab boundaries: 50 (+45.342%, t > 13.431), 100
(+55.134%, t > 16.384), 200 (+33.341%, t > 15.232), and 300
(+42.138%, t > 19.958).

We also detected spikes at round numbers: 10 (+15.341%, t > 5.315),
20 (+18.576%, t > 6.152), 30 (+11.341%, t > 4.319).

The statistical significance of every deviation listed above is over
99.9%. Further, every deviation has a positive mantissa. This leads us
to confidently declare the existence of a systematic bias in the meter
readings analysed.

You’re probably thinking: “I know why he’s put this example here. It must be a bad one. So, what a rotten paper it must be!”

Well, not quite. It’s a good piece of analysis. I did it myself and there’s a fair bit of effort and care behind these short paragraphs.

The trouble is, if I read it out to my daughter, she’d say “What?” and not understand a word. My wife’d say “So what?” and not care a bit. I might as well not have written it.

It’s like that Zen thing: If a tree falls in a forest and no on hears it, does it make a sound?

If you did a piece of analysis, and no one understands or cares about it, why did you do it in the first place?

Why do you do it?

That last question is important: why do we analyse?

Sometimes, we do it for fun. The knowledge is beautiful. Knowing Tetris is NP-Complete is rewarding, even though my colleague sarcastically remarked, “Thank God! I’m sooo relieved now that I know that Tetris is NP whatever.” If that’s the case with you, great. Write the analysis any which way you’ll enjoy.

Sometimes, we do it because we’re forced to. In class. At work. Wherever. But that’s another way of saying “I don’t know why I’m doing it.” In that case, I’d gently recommend watching 3 Idiots.

Most often, we do it to share knowledge and drive actions. In that case, if no on understands it, or does anything with it, why do it?

Keep it simple

We prerajulisation of Farhanitate flagellated with ...

Would your audience understand that? Or are you just scared that simple words indicate a simple mind?

I was once afraid. 15 years ago, when writing a paper on IBM India’s competitive advantage for the CXOs, I was worried about it being too simple. I didn’t know anything about management. So I filled it with jargon. They politely nodded when I presented it, but I wasn’t fooling anyone. If there’s no content, jargon doesn’t help.

Unfortunately, it’s become polite to accept jargon as a substitute for substance. Why were they not ripping me apart? Or at least, kindly asking me what on earth I wanted to say?

My friend Manoj did that. In his nice, humble way, he asked, “But Anand, what does this mean?” When I explained it to him, I found I didn’t have a clue. He was OK with that. He just wanted to make sure he hadn’t missed something.

(That’s the technique I use these days. Ask people to explain things clearly. It’s OK if they’re just lost in jargon. I just want to make sure I haven’t missed something.)

Don’t cloak your ignorance. No one will think less of you. In the long run, you’ll learn more, and won’t need the jargon.

Part 2 of the article will talk about focusing on people and actions; storylining and the pyramid principle; and the structure of messages.

Colour spaces

In reality, a colour is a combination of light waves with frequencies between 400-700THz, just like sound is a combination of sound waves with frequencies from 20-20000Hz. Just like mixing various pure notes produces a new sound, mixing various pure colours (like from a rainbow) produces new colours (like white, which isn’t on the rainbow.)

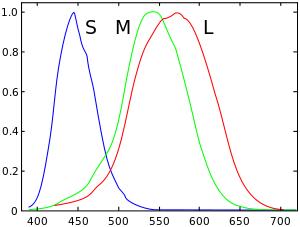
Our eyes aren’t like our ears, though. They have 3 sensors that are triggered differently by different frequencies. The sensors roughly peak around red, green and blue. Roughly.

It turns out that it’s possible to recreate most (not all) colours using a combination of just red, green and blue by mimicking these three sensors to the right level. That’s why TVs and monitors have red, blue and green cells, and we represent colours using hex triplets for RRGGBB – like #00ff00 (green).

There are a number of problems with this from a computational perspective. Conceptually, we think of (R, G, B) as a 3-dimensional cube. That’d mean that 100% red is about as bright as 100% green or blue. Unfortunately, green is a lot brighter than red, which is a lot brighter than blue. Our 3 sensors are not equally sensitive.

You’d also think that a colour that’s numerically mid-way between 2 colours should appear to be mid-way. Far from it.

This means that if you’re picking colours using the RGB model, you’re using something very far from the intuitive human way of perceiving colours.

Which is all very nice, but I’m usually in a rush. So what do I do?

  1. I go to the Microsoft Office colour themes and use a colour picker to pick one. (I extracted them to make life easier.) These are generally good on the eye.
  2. Failing that, I pick something from http://kuler.adobe.com/
  3. Or I go to http://colorbrewer2.org/ and pick a set of colours
  4. If I absolutely have to do things programmatically, I use the HCL  colour scheme. The good part is it’s perceptually uniform. The bad part is: not every interpolation is a valid colour.